
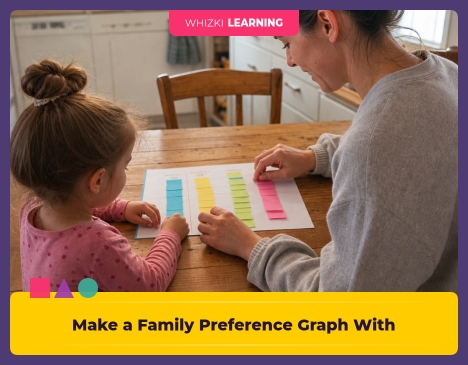
When everyone wants a different snack, show, or park, a family preference graph can turn the argument into one small vote you can try today. Hand each person one sticky note, ask one harmless question, and line the notes up by choice on the table or fridge. The family graph gives young children a way to see fairness, number, and opinion without a lecture.
Reviewed by Dr. Anna Klein, EdD, Early Childhood Curriculum Specialist.
Why a tiny family graph works
A family preference graph is a real investigation, even when the sample is only three or five people. Reggio-inspired teaching often starts with children's real questions, and a family vote gives children something concrete to notice. NAEYC guidance also values math talk that grows out of daily routines, not math that lives only on a worksheet.
The graph builds comparison before symbols, which matters for ages 3 to 7. In the previous math at home guide, the main idea was that children need to see more, fewer, and same before signs make sense. Sticky notes make those amount words visible because each note stands for one person.
Set up the question and votes
The setup takes about 5 minutes, and the materials are ordinary: sticky notes, a marker, and a flat surface. Occupational therapy basics remind teachers and parents that young hands do better with big paper, clear space, and a stable surface. If sticky notes curl or distract a child, folded scrap paper and tape work just as well.
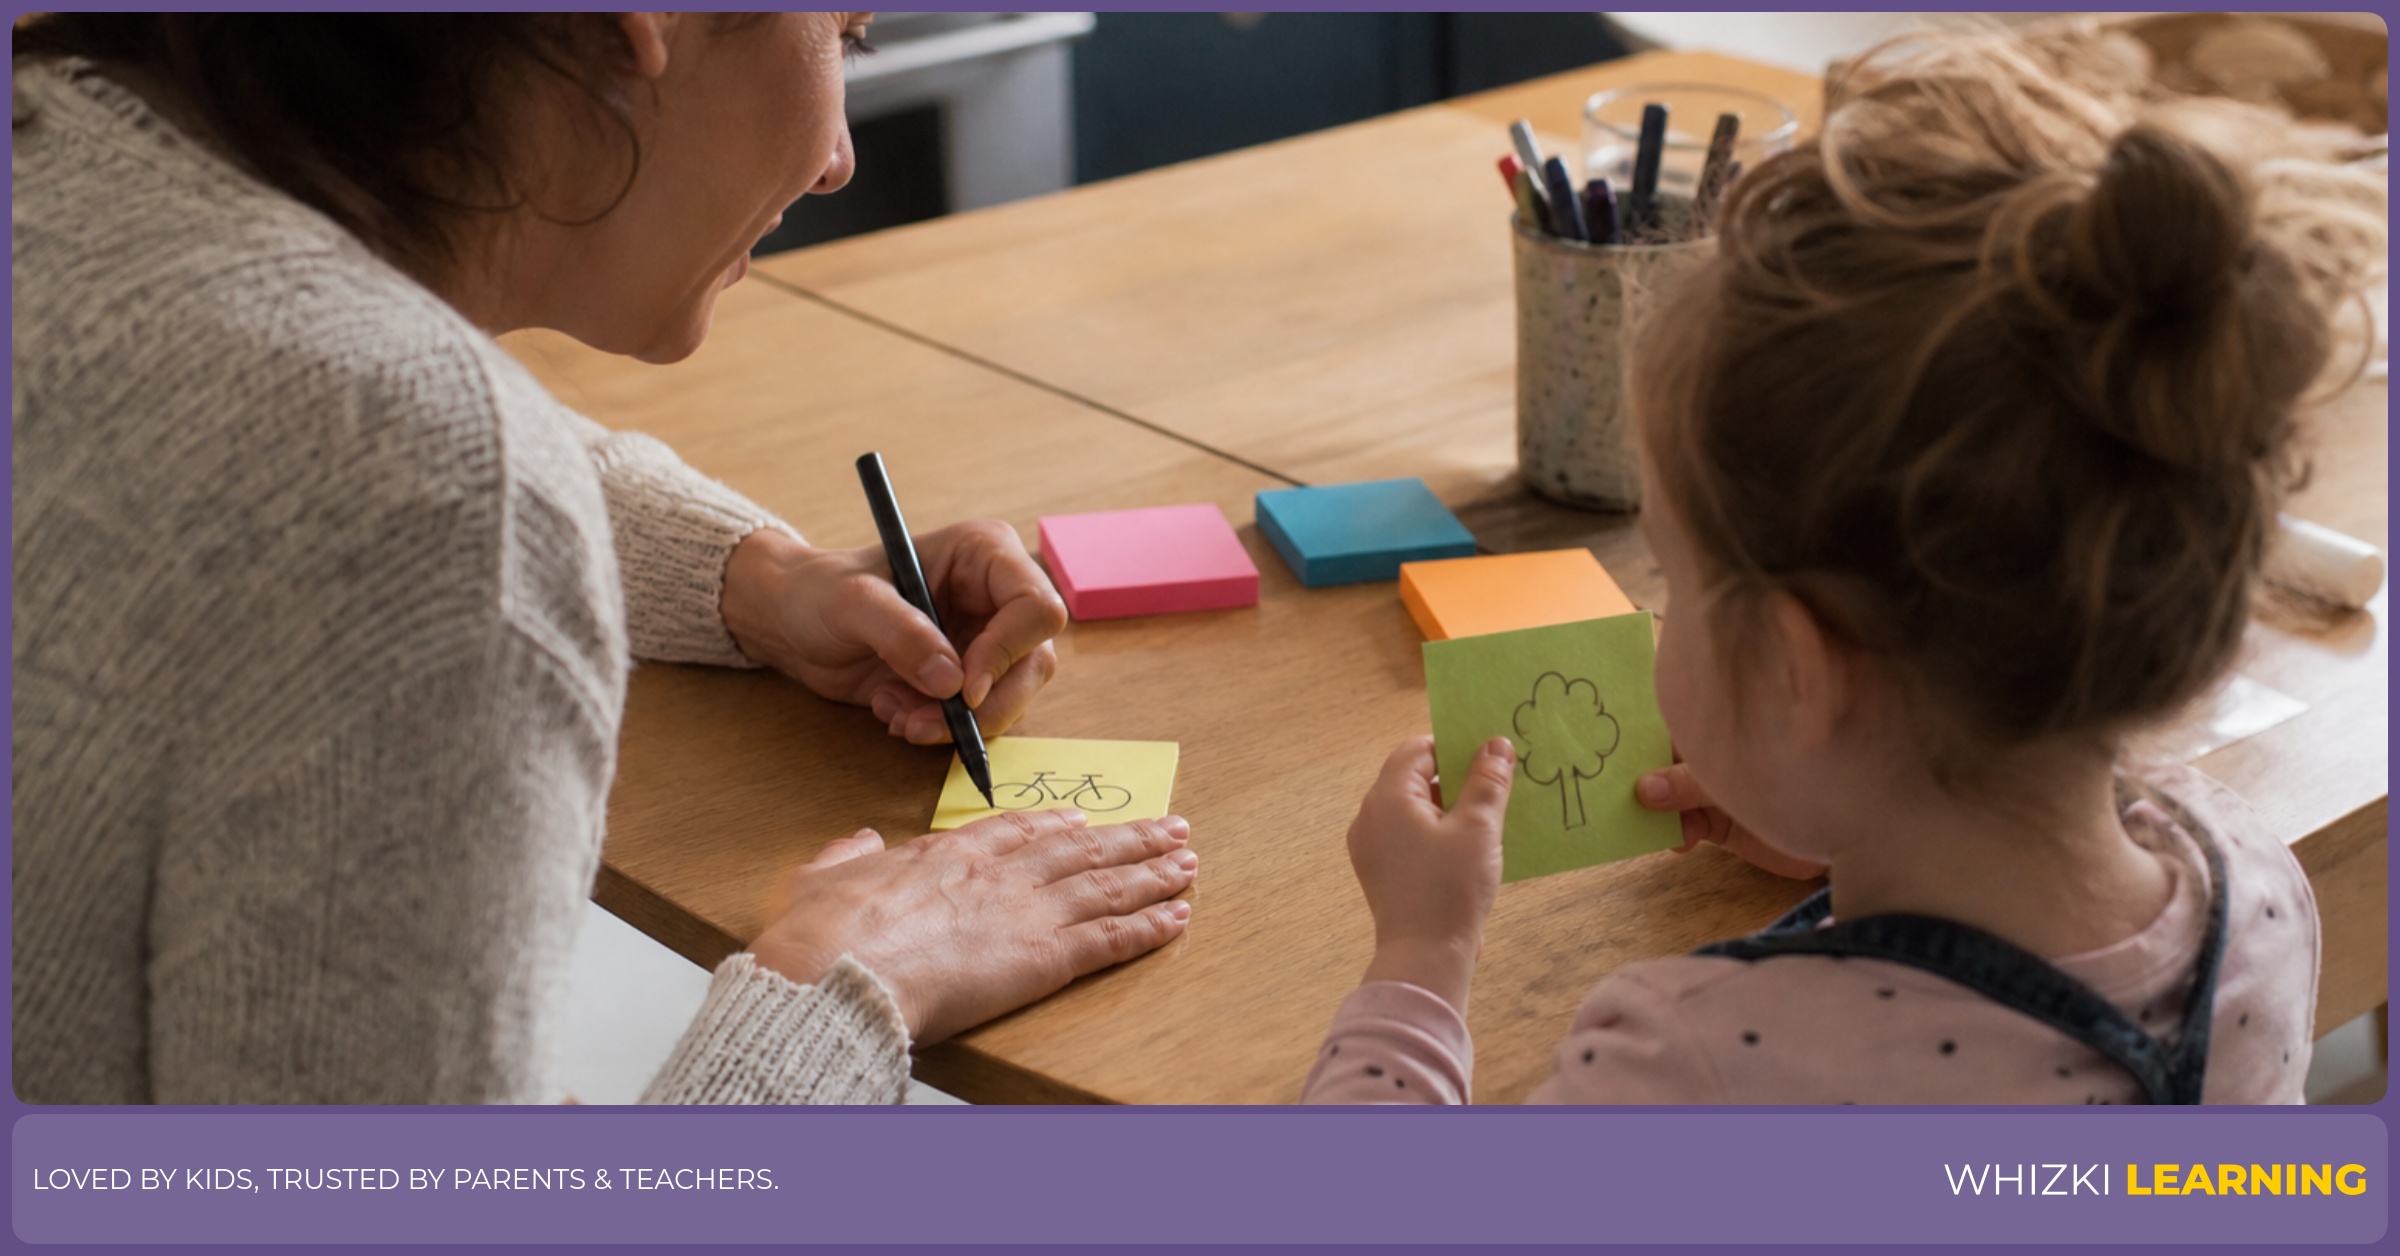
The best question is harmless, limited, and real. Ask, "Which fruit should we cut for snack, apples, bananas, or oranges?" or "Which book should we read first, bears or trucks?" Each person gets one vote, and the adult can draw a quick picture for each choice so pre-readers can join without guessing words.
Build and read the graph together
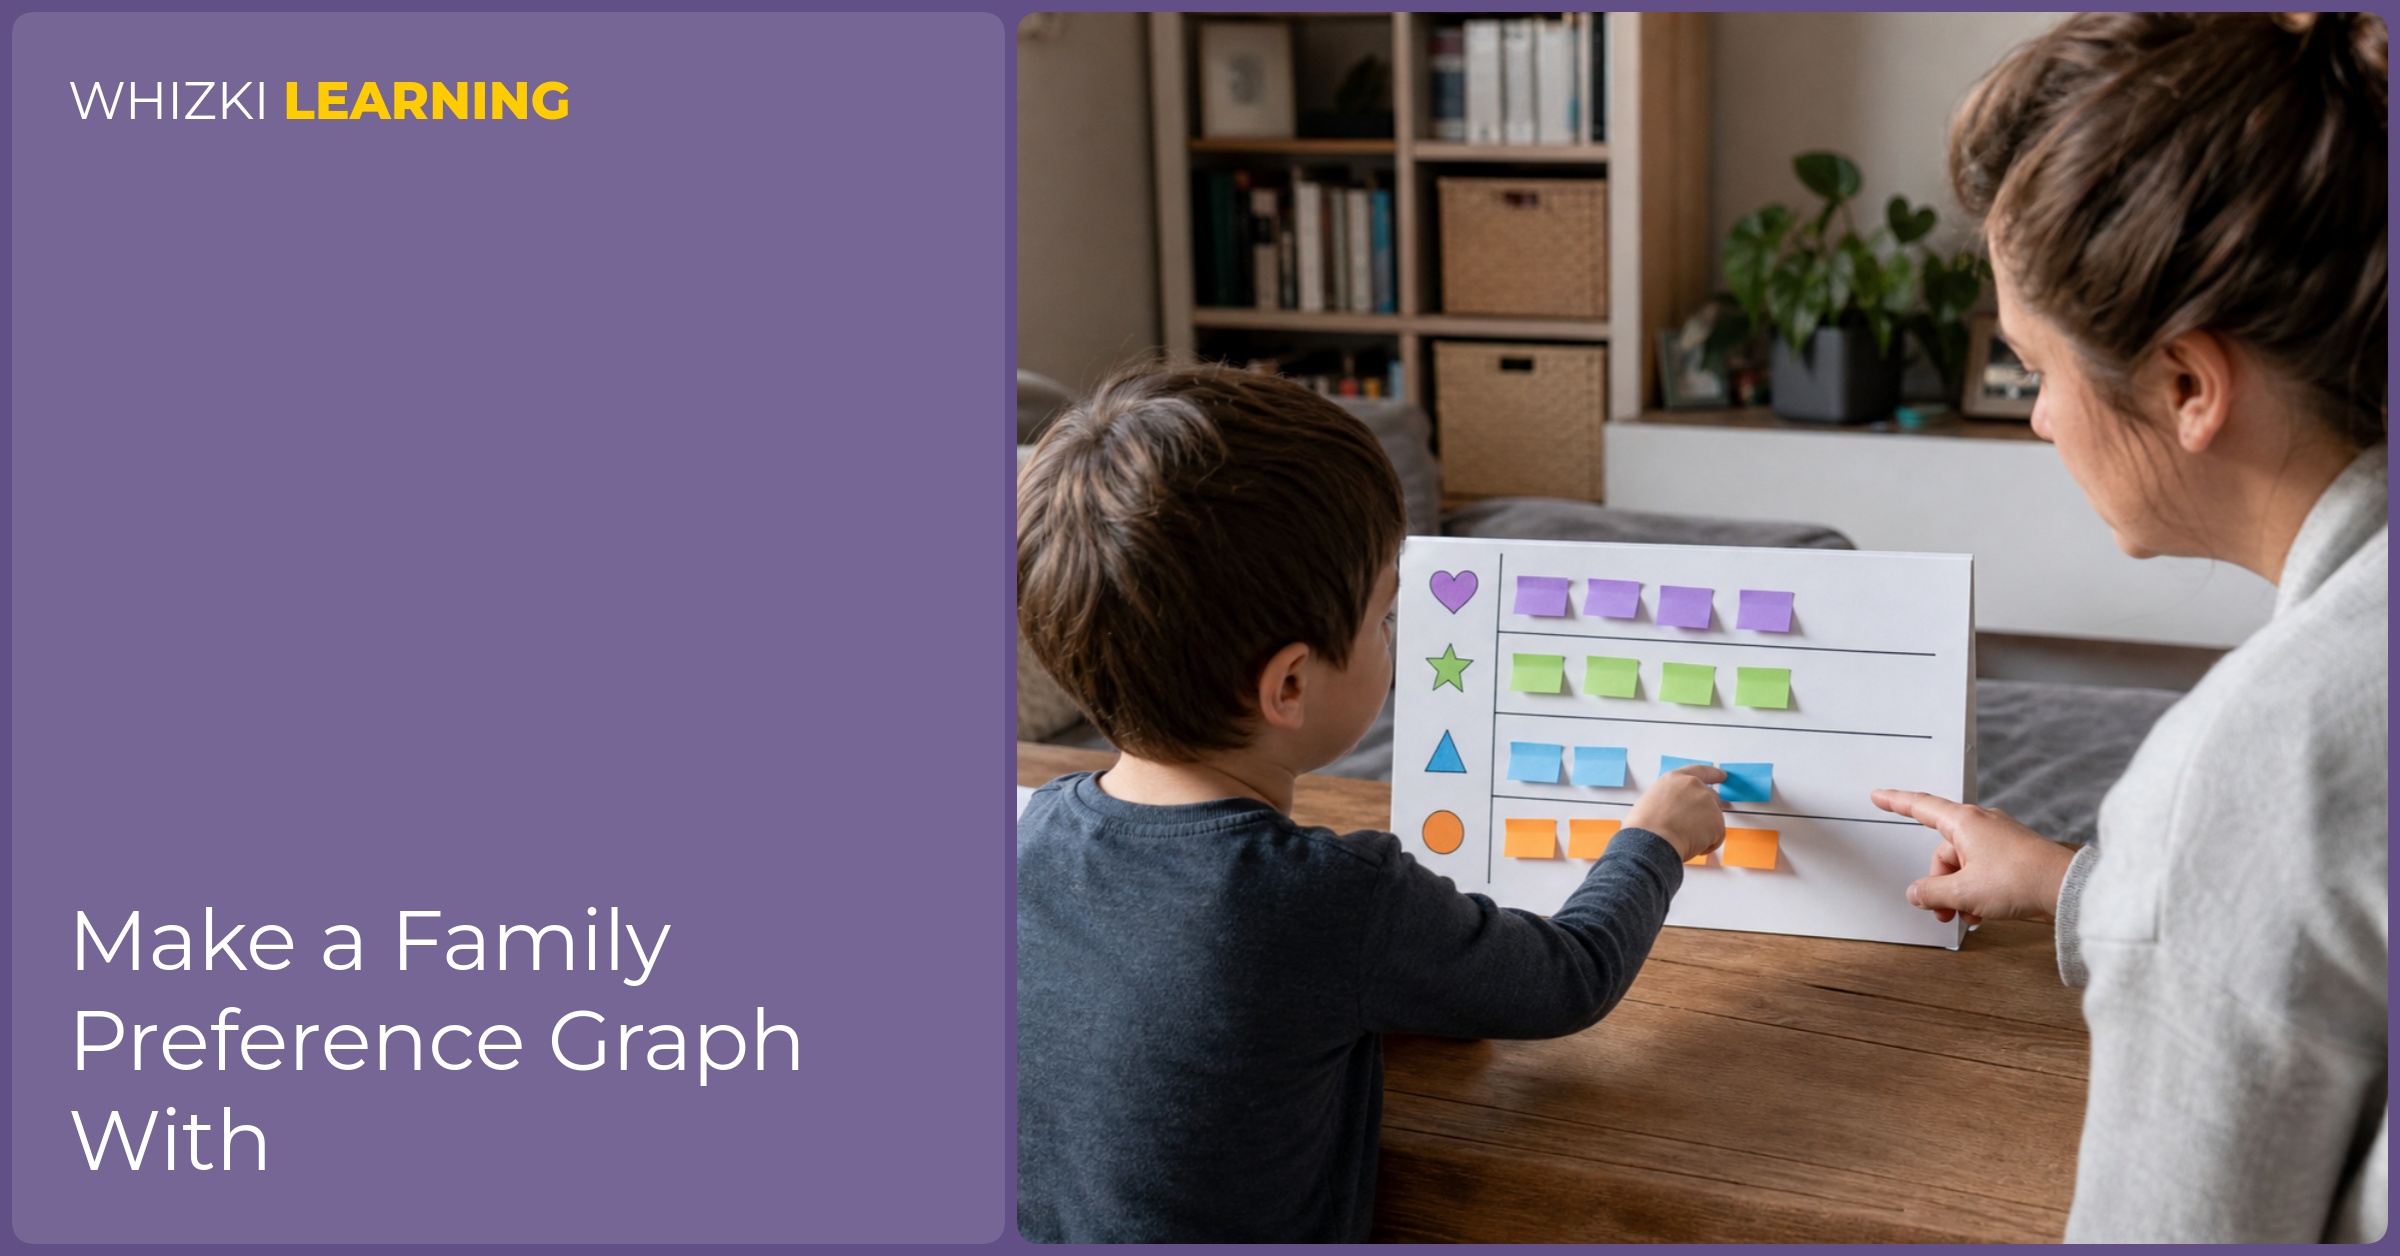
The adult writes or draws the choices across the top of the table, fridge, or chart paper. Each voter places one sticky note under or above the chosen option, with the notes lined up edge to edge. The straight rows help children count one object at a time and compare row lengths without rushing.
The family reads the graph out loud after every vote is placed. In Orton-Gillingham lessons, children learn well when hearing, saying, touching, and seeing connect, and the same multisensory pattern supports early math language. If a child wants more table activities after the graph, the Learning Hub has simple practice ideas for counting, sorting, and talking about amounts.
Whizki Learning keeps simple sorting and graph pages in the printable library for families who want a ready-made page nearby. A blank page is still enough for today, so use a printable only when the paper saves time.
Talk about what the sample can tell
The family sample can tell which choice got more votes in one room today. The family sample cannot tell what all children prefer, what tomorrow's choice will be, or which choice is best forever. NAEYC-aligned math talk stays honest by naming the size of the group and the exact question asked.
The adult can say, "In our family today, bananas got the most votes," and stop before making a bigger claim. Reggio documentation uses observation carefully, and a sticky-note graph deserves the same care in a small child-friendly way. The graph shows a preference, not a rule about a child's personality or a promise about the next vote.
Age adjustments and real-life repairs
For ages 3 and 4, the adult can limit the vote to two choices and place the first sticky note as a model. An occupational therapy heuristic I use often is bigger movement before smaller movement, so large sticky notes on a wall may work better than tiny marks on paper. A preschool child can point, place, count with help, and hear the words more and fewer.
For ages 5 to 7, the adult can add tied, same, and one more than after the rows are built. Speech-language pathology practice often values wait time and full sentence modeling, so the adult can pause and then offer, "The apple row has one more vote than the orange row." If a child is disappointed, the repair is simple: the winning vote guides only the decision that was named, and the next family choice can use a new graph.
The family preference graph is small on purpose, and that small size is the lesson. Children see that math can help a group make one ordinary decision, and children also hear that a tiny sample has limits. Try the graph at snack, story time, or before a walk, then put the sticky notes in the recycling when the decision is done.